So, what are linear inequalities, you ask? Well, think of them like boundaries or limits that we need to work within. For example, imagine you're planning a road trip and you need to stay within a certain budget - that's like a linear inequality in real life!
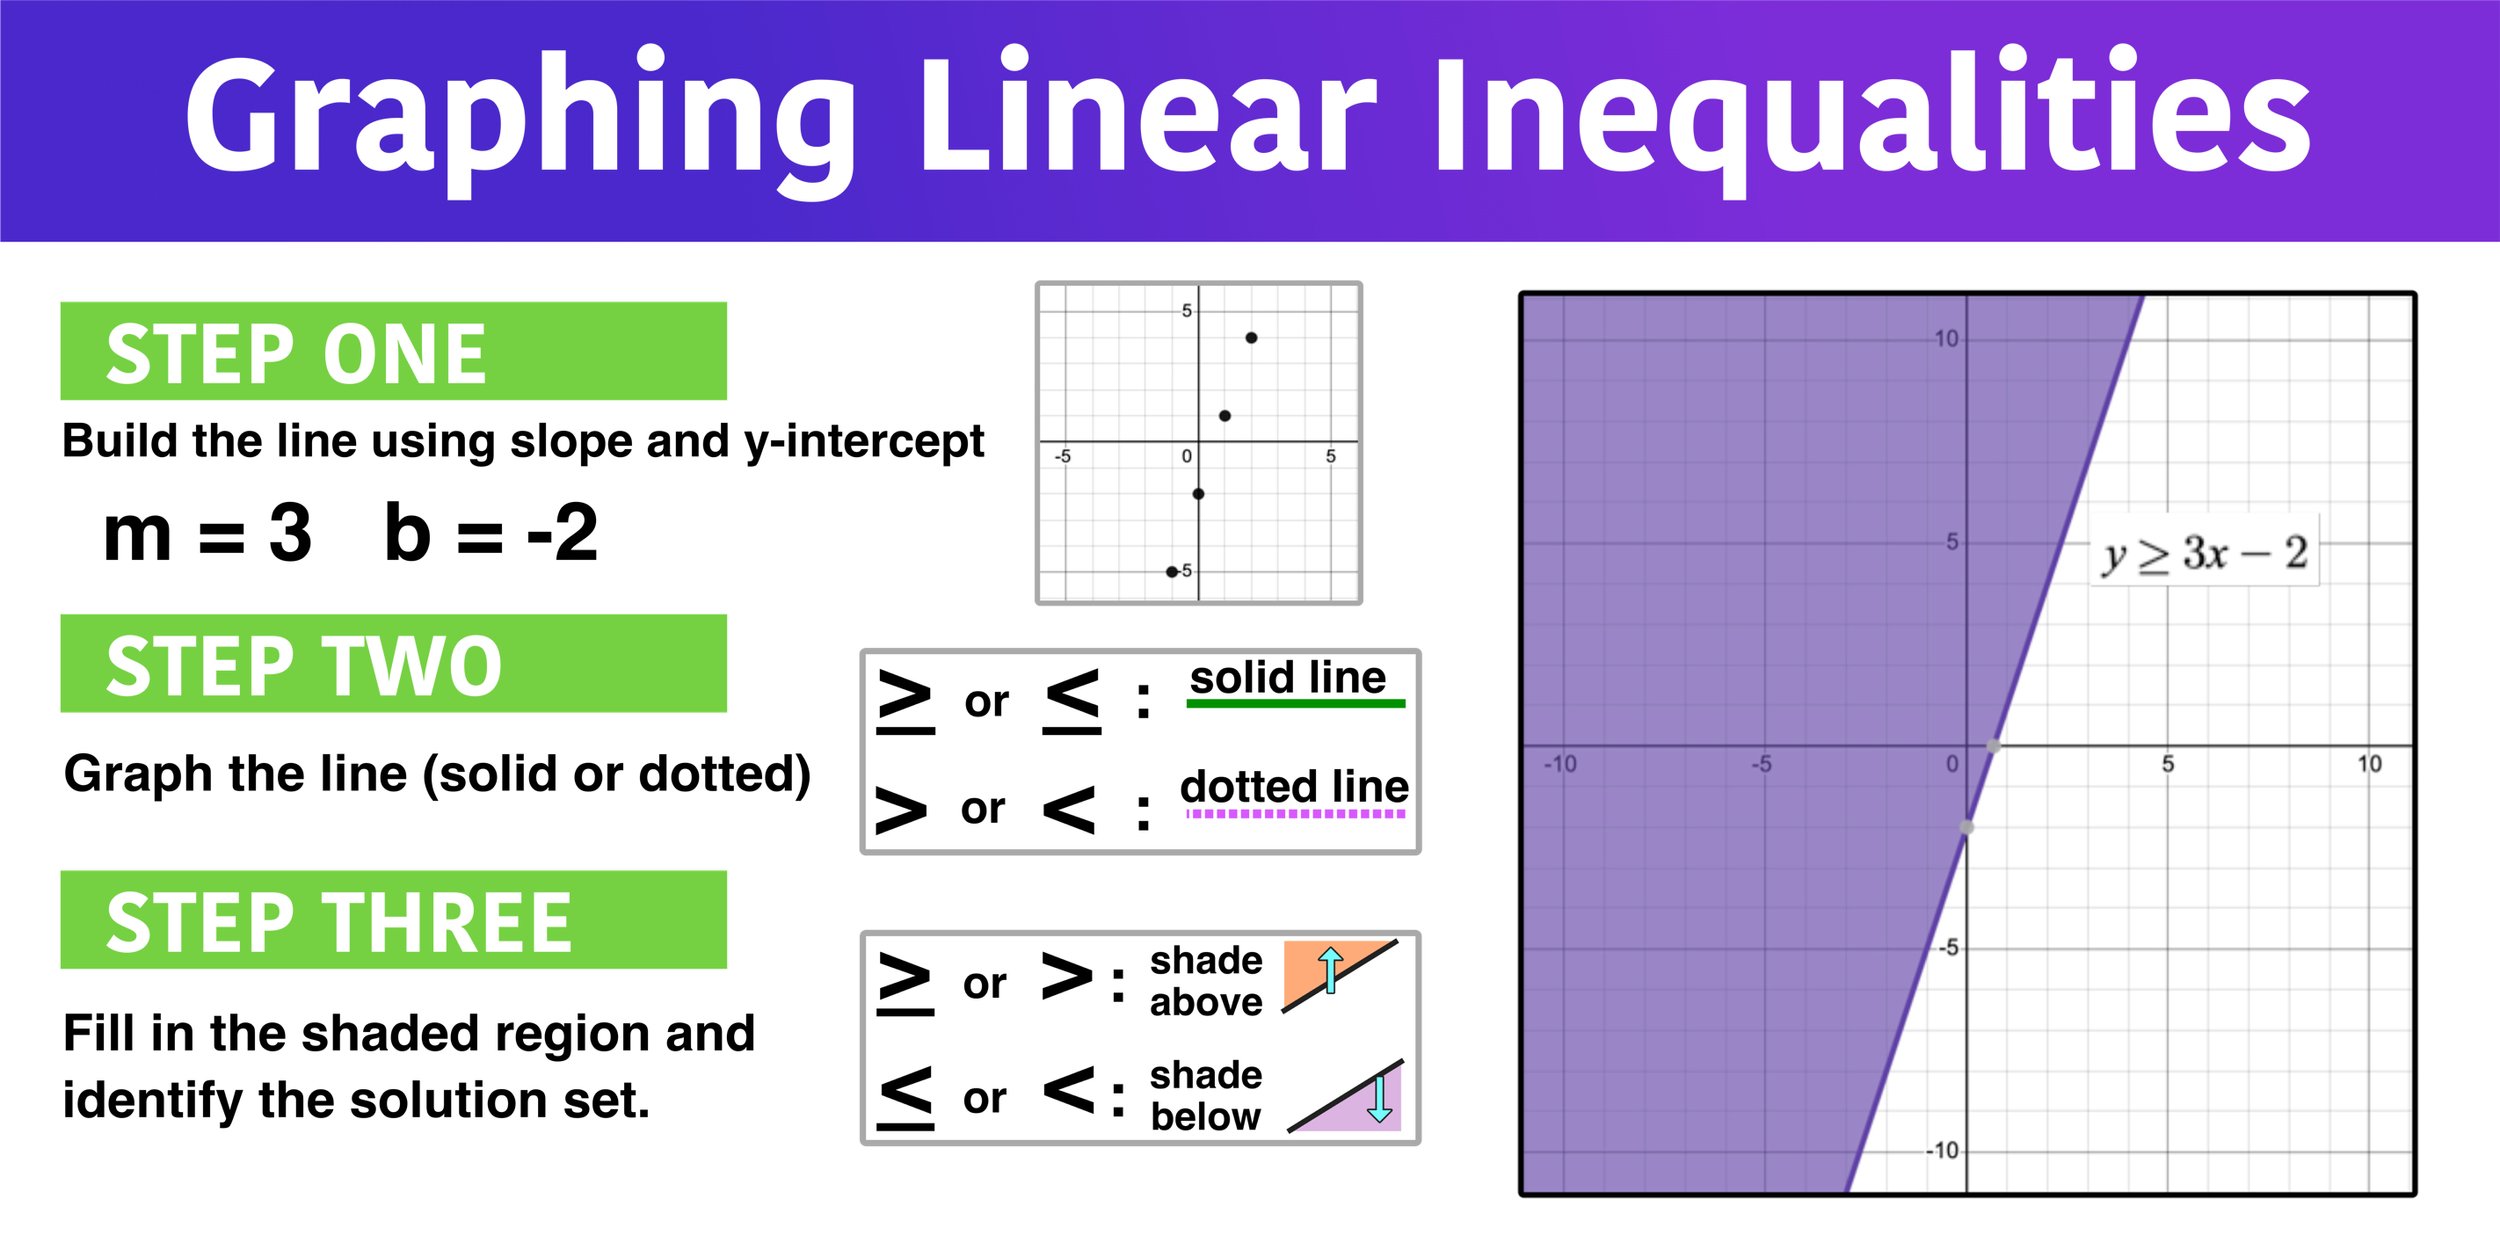
Now, when we graph these linear inequalities, we're basically creating a visual map of these boundaries. It's like drawing a treasure map to help us navigate through the problem. And, just like a treasure map, we need to use coordinates and axes to pinpoint the exact location of our solution.
But, here's the cool thing about graphing linear inequalities - we can use shading to show which areas of the graph are included or excluded from the solution. It's like coloring inside or outside the lines, depending on the inequality. And, just like a puzzle, we need to figure out which areas are allowed and which ones are off-limits.